Demo

A Swiss network that doesn't exist. Break it, then ask shift.

The demo runs shift against real MCP servers and a simulated enterprise network. Nothing in it is a customer's: the devices, their traffic and their logs come from a simulator.

Already have access? Open the demo

Access

How to get access

The demo is for named people. Write to us, and we create an account for you at the demo's sign-in service. You then sign in with a one-time code by e-mail and set up a passkey; there is no password. One sign-in lasts a week.

  1. Send the request below. Tell us what you want to see: the network, the shop in Kubernetes, or both, and whether you want to break things too.
  2. We create your account, usually within a working day.
  3. You get an e-mail from the demo's sign-in service. Sign in, add a passkey, and open the demo.
Request demo access

Opens your e-mail program with a prepared message to hello@zebbra.ch.

Before you start

The demo is ours, not yours: it runs on zebbra's infrastructure with a hosted model, so what you type goes to that model's provider. Please don't enter real data from your network.

Want to see it on your own network? Write to us about a trial on your infrastructure.

What you'll find

Every tool in the demo was reviewed by an admin, as in a real installation. Reading a pod's log is Sensitive, so shift asks you first.

LTE backup mpls-cloud BRN Bern ZRH Zürich BSL Basel GVA Genève LUG Lugano
  • The network.

    Five sites: Bern (headquarters and data centre), Zürich, Basel, Genève, and Lugano with an LTE backup. Routers, switches, firewalls, wireless and servers, in NetBox.

  • Metrics and logs.

    VictoriaMetrics holds interface traffic, errors, uptime and reachability; VictoriaLogs holds every device's syslog.

  • Things going wrong.

    On a schedule: a link flaps every 90 minutes, an uplink fills up every two hours, a device reboots every three hours. Each episode ends by itself.

  • A web shop in Kubernetes.

    The OpenTelemetry Demo's Astronomy Shop, about 15 services in their own namespace, with a load generator as its customers. Its feature flags break it on purpose: failing payments, a crashing cart, a leaking cache, a Kafka backlog.

  • Grafana and alerts.

    Dashboards for the network and the shop, and alerts you can check shift's answers against.

Three stories to start with

Network

  • Which interfaces flapped in the last six hours, and what is on the other end of each?
  • Why is the uplink of rtr-zrh-1 so full? Who is behind it?

The shop

  • Is anything unhealthy in shift-sandbox?
  • Why have checkouts been failing for the last ten minutes?

An alert

  • ShopErrors fired for checkout. Since when, and which service is behind it?

Everyone in the demo may look and ask; breaking things takes a group the demo's owner gives by hand. Ask for it with your access, or ask about the faults the network schedules by itself.
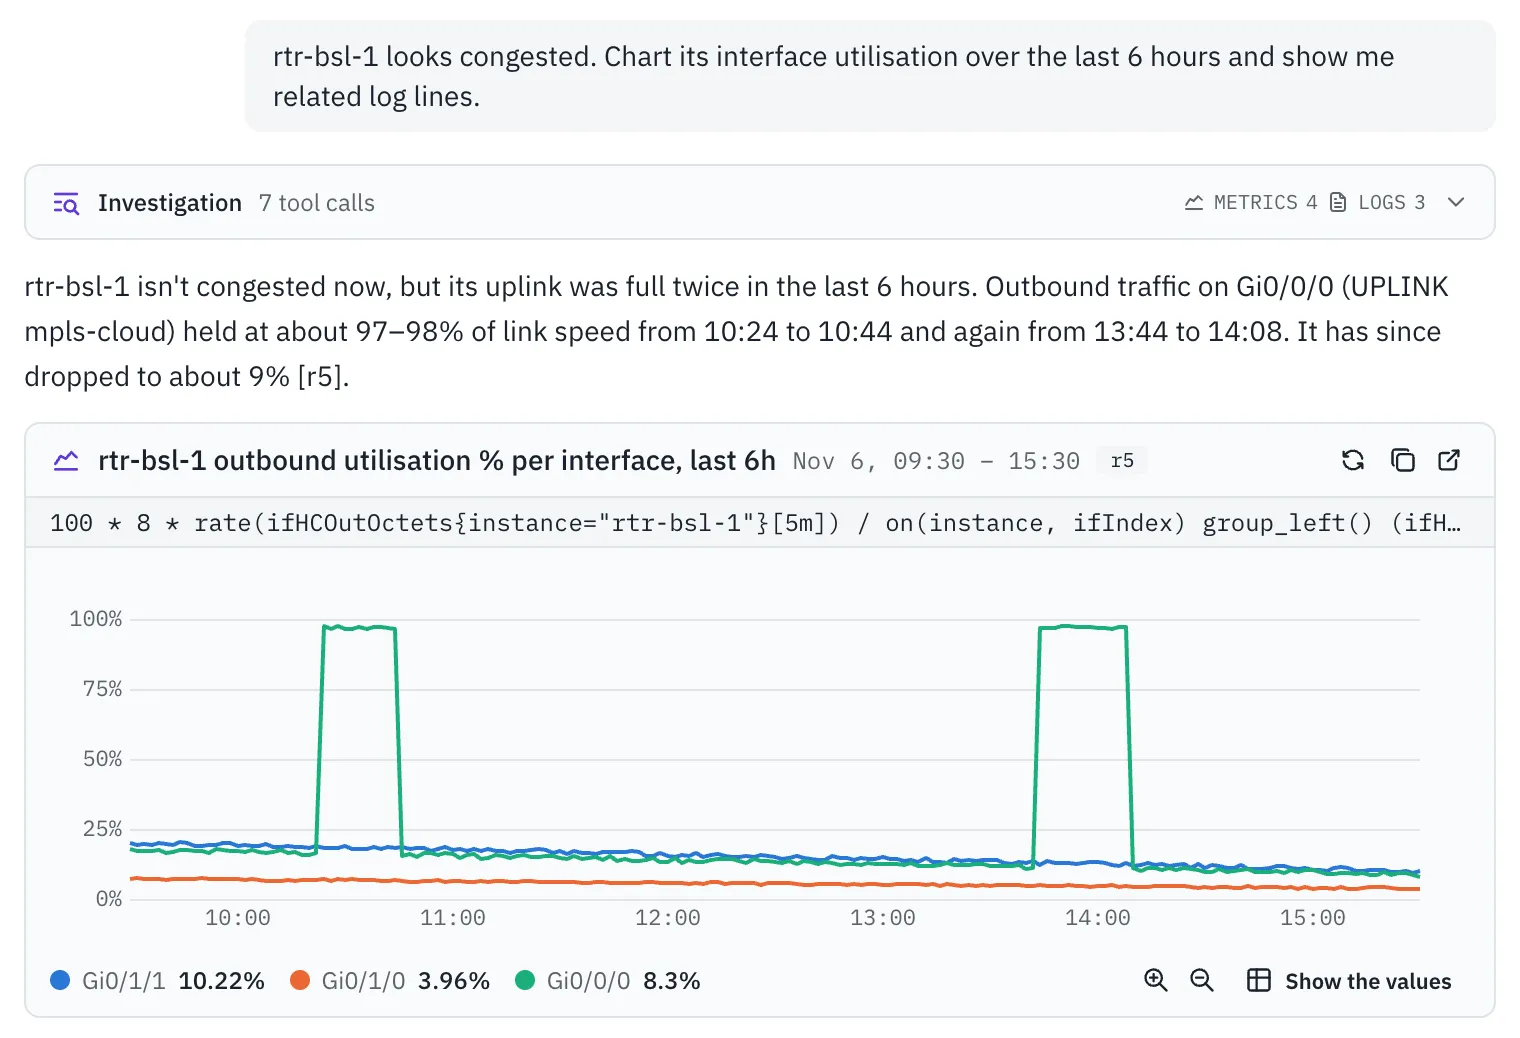
A chat in shift. The question reads: rtr-bsl-1 looks congested. Chart its interface utilisation over the last 6 hours and show me related log lines. A collapsed Investigation row counts 7 tool calls, 4 to metrics and 3 to logs. The answer says the router isn't congested now, but its uplink Gi0/0/0 to the MPLS cloud held at about 97 to 98 percent of link speed twice, from 10:24 to 10:44 and from 13:44 to 14:08, and has since dropped to about 9 percent. Below, a chart of outbound utilisation per interface from 09:30 to 15:30 shows the two plateaus near 100 percent, with its MetricsQL query, buttons to refresh, copy and open it, and a legend with the latest value of each interface.
A network question in a development build with invented example data: the uplink chart and the answer behind it.
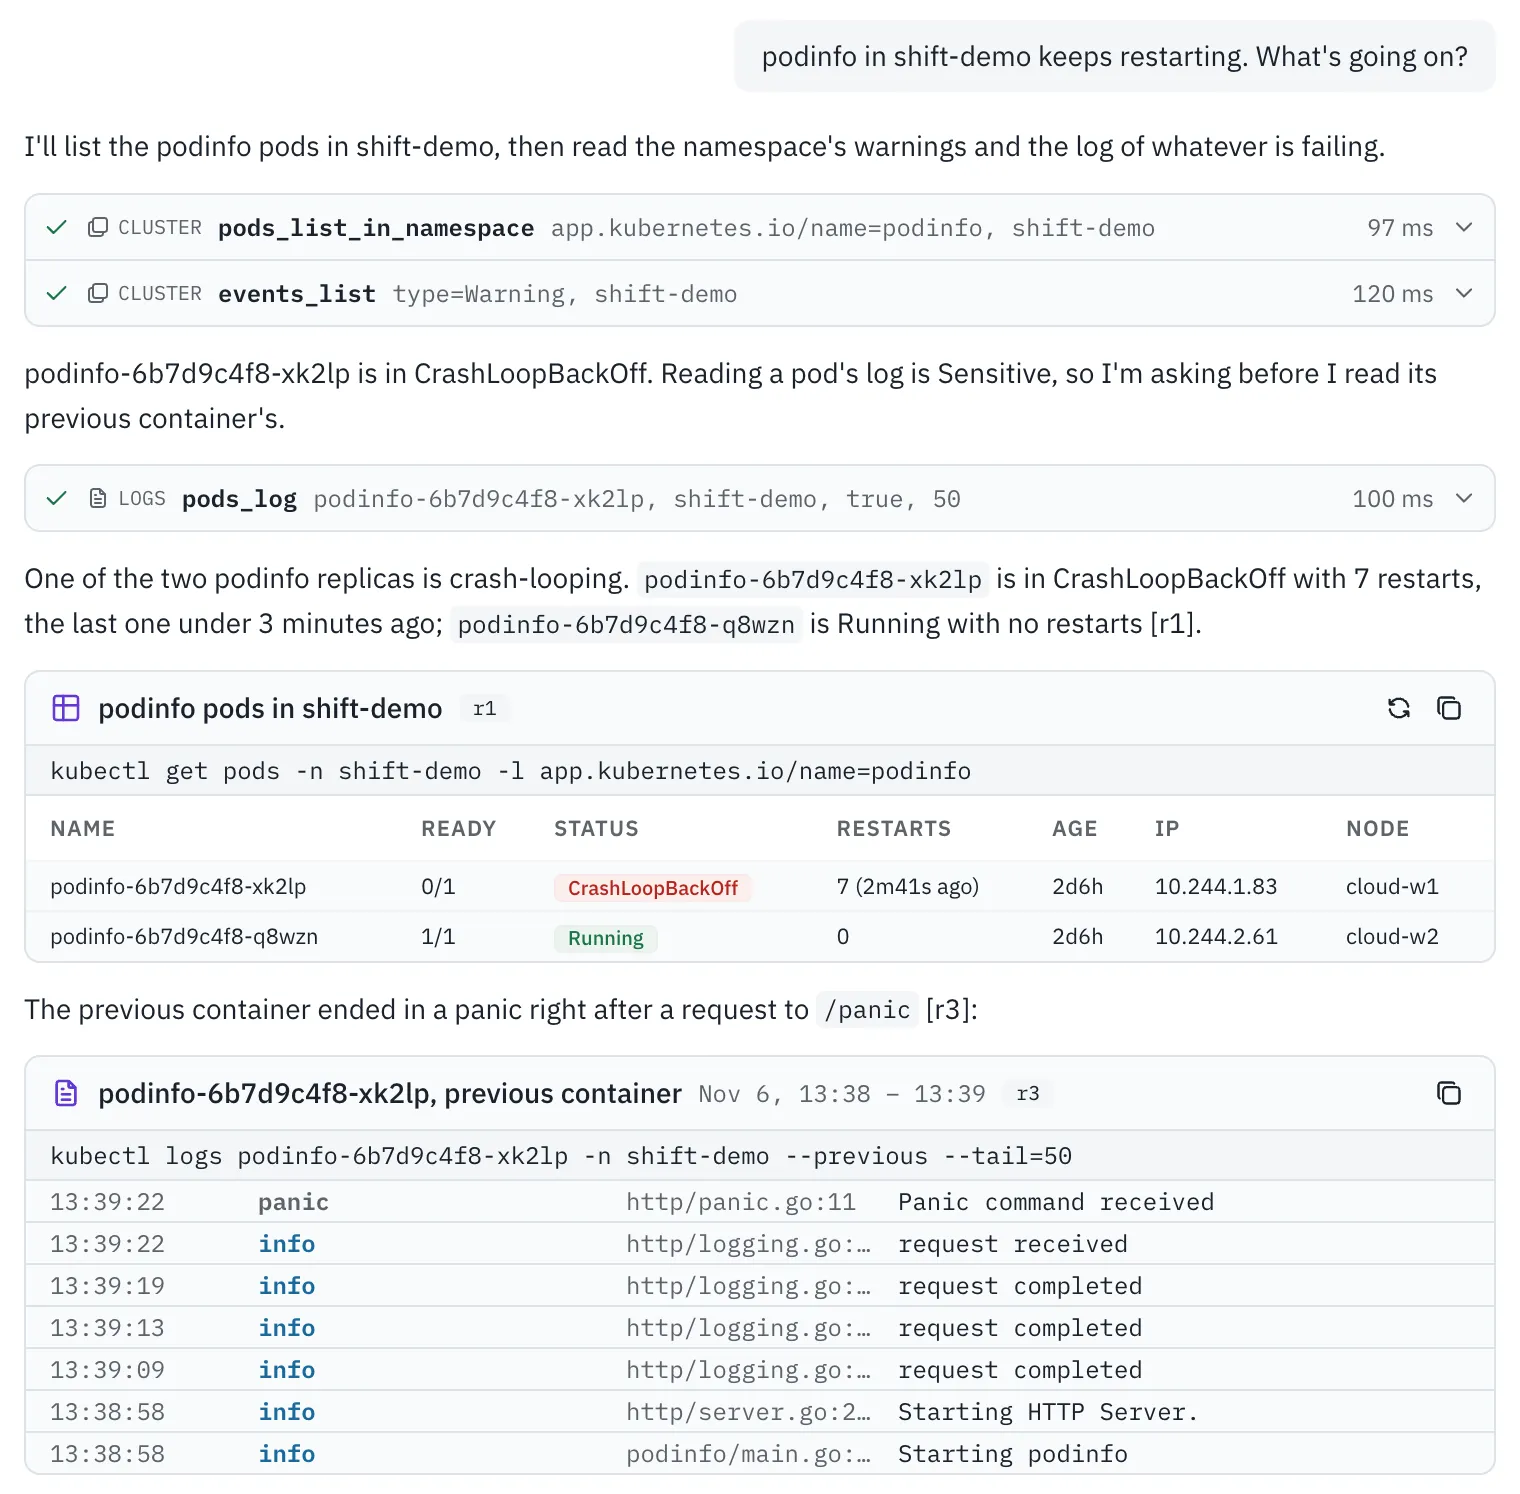
A chat in shift. The question reads: podinfo in shift-demo keeps restarting. What's going on? Three tool rows show pods_list_in_namespace and events_list on the cluster and pods_log, each with a check mark and its duration; the assistant notes that reading a pod's log is Sensitive and asks first. The answer says one of the two podinfo replicas, podinfo-6b7d9c4f8-xk2lp, is in CrashLoopBackOff with 7 restarts, while podinfo-6b7d9c4f8-q8wzn is Running. A table lists both pods with ready count, status, restarts, age, IP and node, under the line kubectl get pods. A log card for the previous container, with its kubectl logs line, shows podinfo starting, serving requests, receiving a request to /panic and logging Panic command received at level panic.
A Kubernetes question in the same build: the crash-looping replica, and the panic in the log of its previous container. Reading a pod's log is Sensitive, so the assistant asked first.

coming

Coming to the demo

A live map of the simulated network, where you break links and devices yourself and then ask shift what happened.
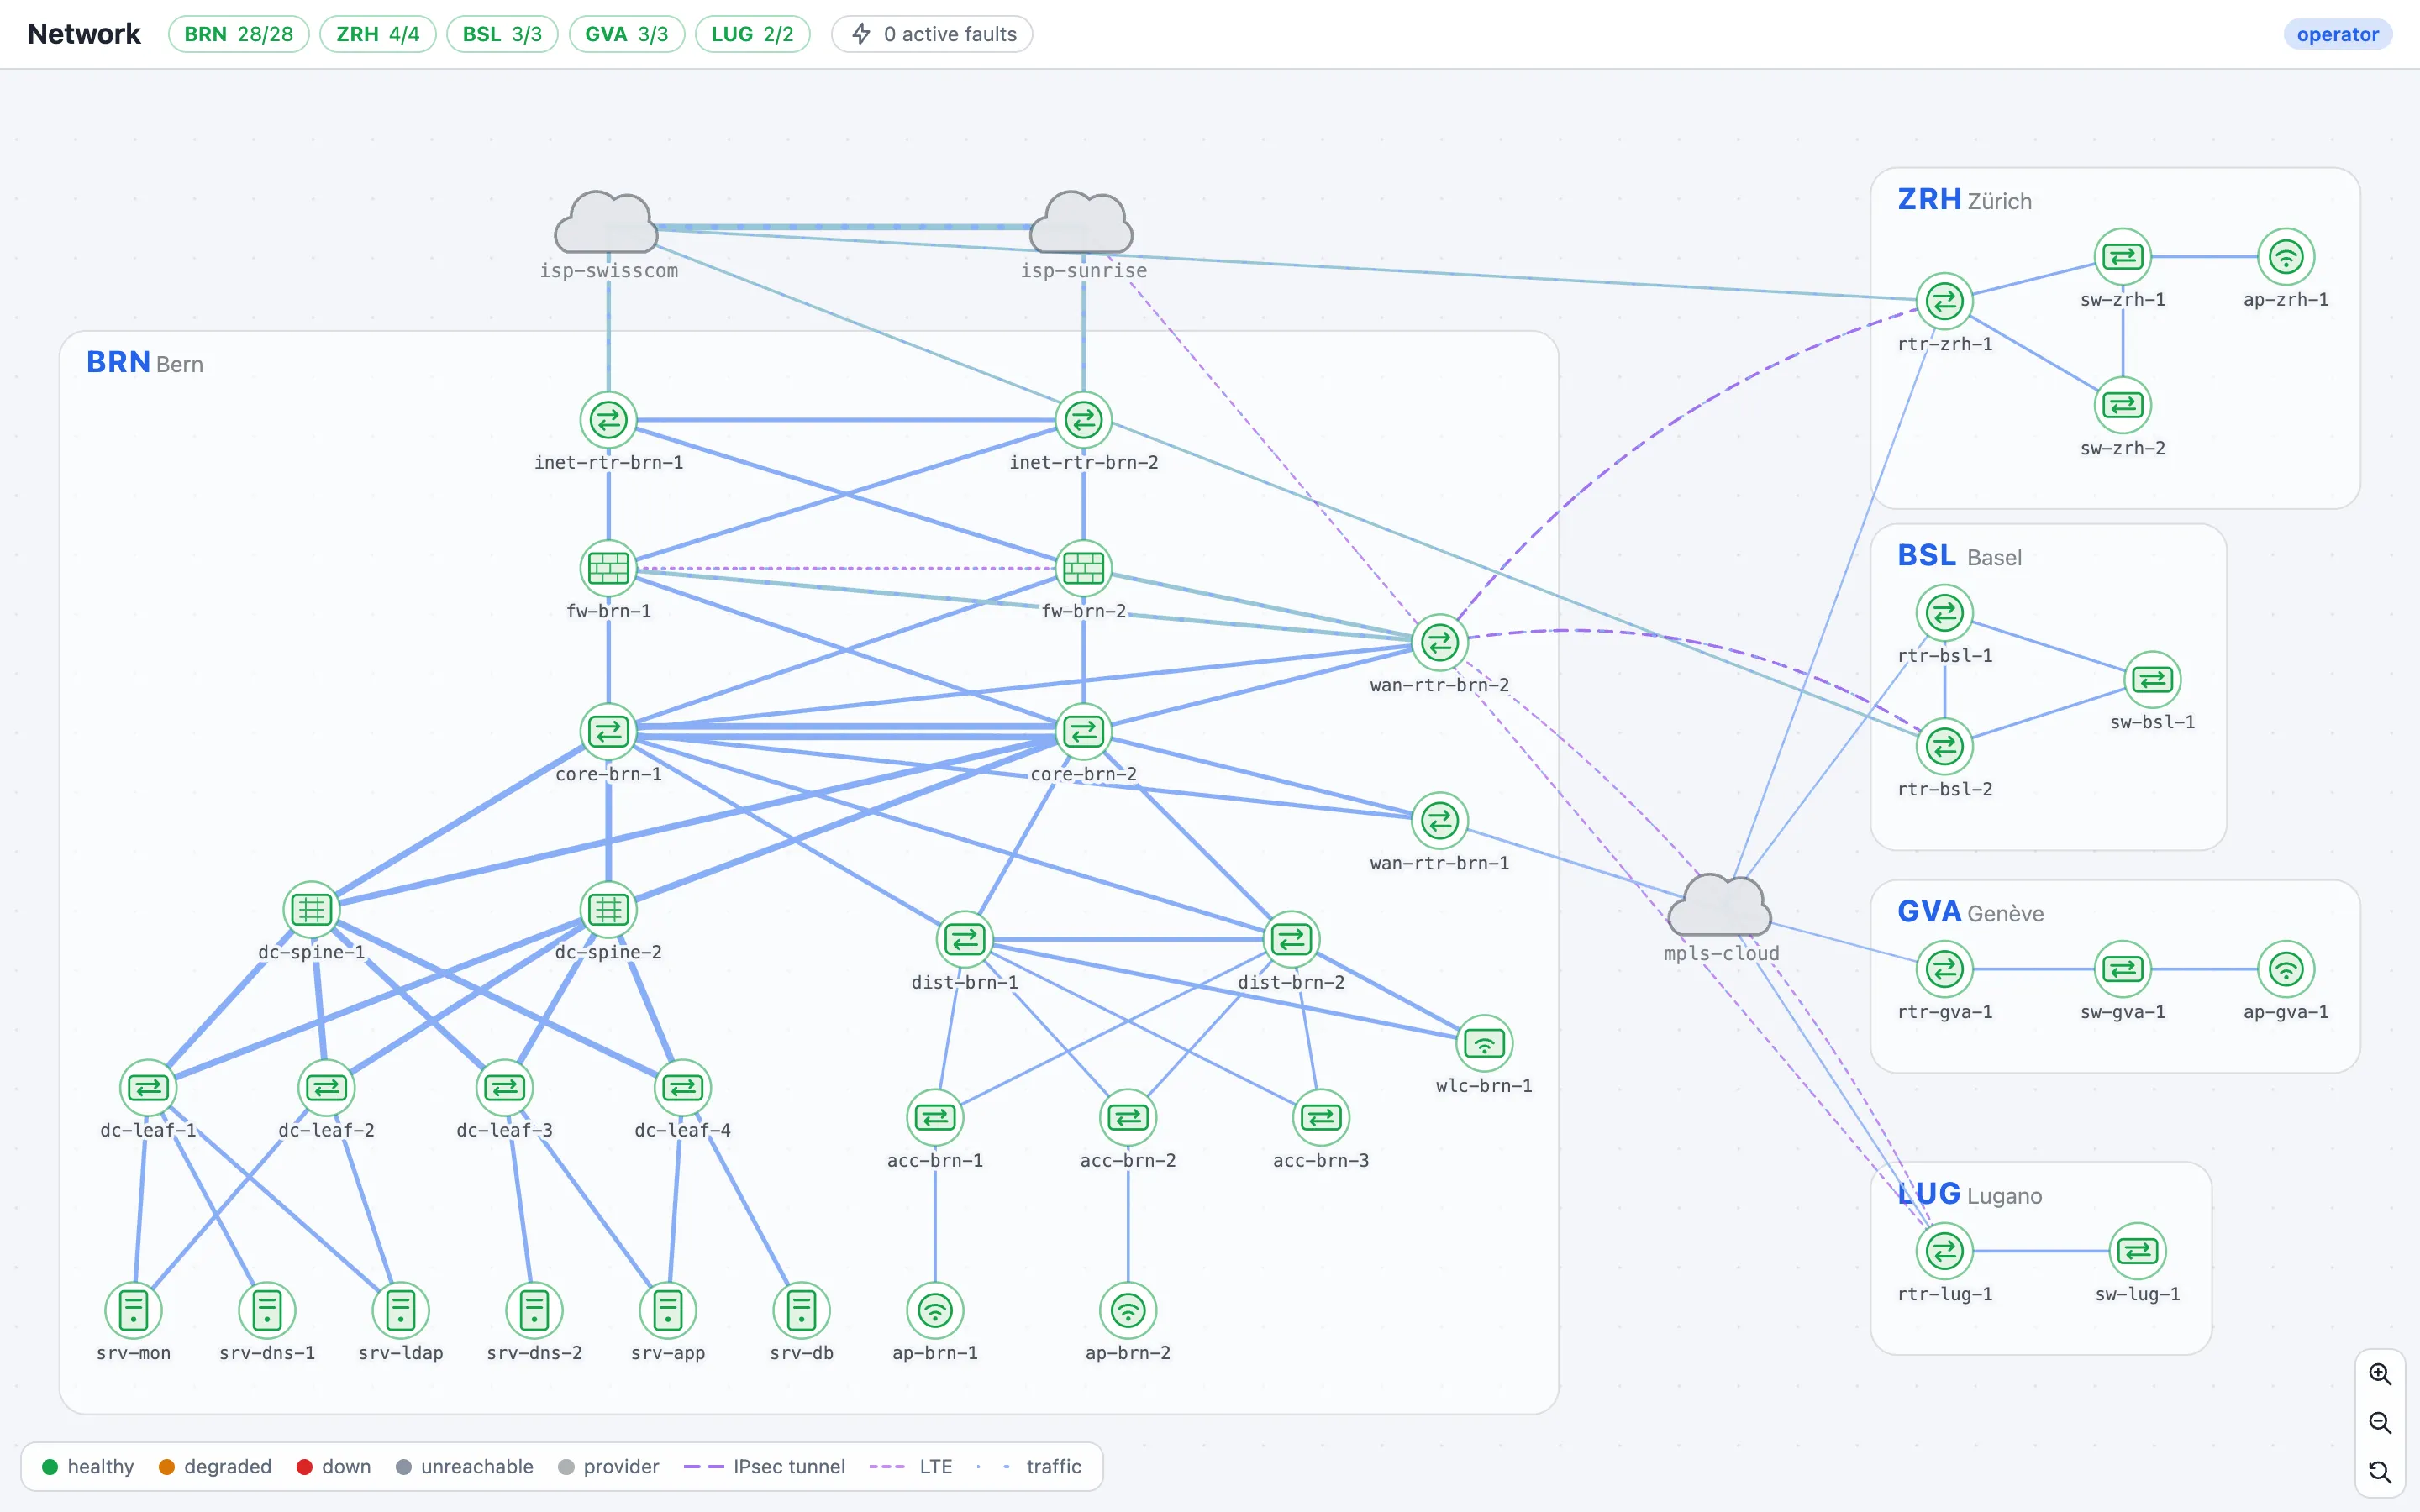
A dark network map titled Network, with site pills BRN 28 of 28, ZRH 4 of 4, BSL 3 of 3, GVA 3 of 3, LUG 2 of 2 and 0 active faults. The Bern site holds internet routers, firewalls, core, distribution and access switches, a data-centre spine and leaf fabric and servers. Links run to the providers isp-swisscom and isp-sunrise and to an mpls-cloud, which connects the Zürich, Basel, Genève and Lugano sites; dashed lines mark IPsec tunnels and the LTE backup. A legend explains healthy, degraded, down, unreachable, provider, IPsec tunnel, LTE and traffic.
The network map in development: the five sites, their providers, the MPLS cloud, IPsec tunnels and the LTE backup, with the health of each site. Coming to the demo soon.